Developing an index for NFT valuations – An overview of the mechanisms that drive token valuations
The growing potential of NFTs (Non-Fungible Tokens) to propel our economy forward places these financial instruments at the forefront of attention. But, unlike traditional assets, few tokens demonstrate repeated sales. For those that do, it is rare to see their trading frequency exceed a monthly rate. Even more problems arise for tokens which have never been sold before. This leads to the following question. How do we make sense of the factors that have driven, and potentially still drive NFT sales, to produce sensible valuations for them? Enter machine learning.
Modern software technology is becoming increasingly dominated by black boxes such as Machine learning and Artificial Intelligence solutions. However, their successful application in our settings is less likely when you consider the underwhelming number of input data available (realized token sales per collection). Compared to other applications, such as image and natural language processing, this only strengthens this sentiment. However, you forget that NFTs were created by active collaboration between software developers and artists. And that, ladies and gentlemen, has given birth to NFT metadata, the holy grail in valuing tokens.
In (automated) grouping we trust – Key features derived from token, property and neighborhood rarity indices
I am sure most of you are aware of this by now, but let me recap. There is a clear distinction between punk "tiers" when anyone first examines the Cryptopunks collection. Aliens, apes, zombies, and humans. It almost feels like each of these categories could be a separate collection of its own, given their shared, distinct characteristics and (obviously) price gap. For the most part, the accompanying token properties simply help distinguish between punk types. It is left to the buyer to choose which "looks better."
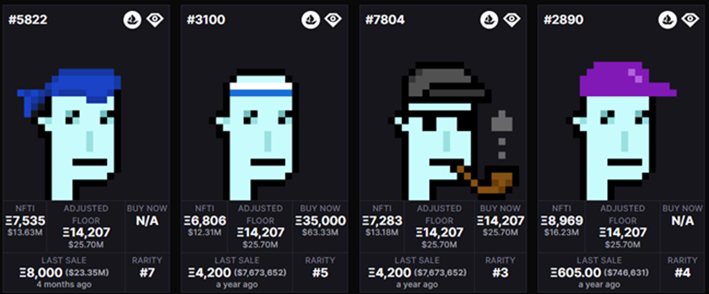
"Collectible" NFTs generally follow the same principle. This led us to realize, after experimenting with major collections such as Bored Ape Yacht Club and Cryptopunks, that signal-reach features lie within these natural groupings. There are numerous collections out there. However, for some, these intra-collection groups might be more obscure. This is where an alteration to the rarity index comes in. Considering not only the rarity of a property's value (e.g., the Cryptopunk's "Alien" Type) within the collection but also its uniqueness when compared to the rest of that property's values (e.g., for the Cryptopunk's Type property, other values would be Zombie, Alien, etc.). For example, if the whole CryptoPunks collection was divided into same-sized punk Types, having an Alien would not be as unique as having any other type of punk.
The above formed an augmented rarity index, allowing us to determine the rarest properties across collections and subsequently use these to derive aggregate statistics on their (historical) prices. Eventually, these features have helped to drive down model errors significantly.
To over-value or not to over-value? A burning question in a volatile market
There are those amongst us that appreciate the art and love collecting tokens that appeal to our personal style. On the contrary, the overwhelming majority has turned to the quick profit strategy (preferably at high margins).
Generally, if not specified otherwise, machine learning models do not distinguish between valuations they generate that are either lower or higher than the target we set during training (more on which is the “target” in a bit). While we do include features relating to FX rates for Ethereum, the low-hanging fruit was also to penalize for over-or under-valuations (given the “direction” of the cryptocurrency market). Especially with the negative outlook that markets have shown at the time of writing, we wanted our valuations to reflect this daily.
Machines learn by means of a loss function, which evaluates against target values how well a specific algorithm models the given data. As explained in the previous section, our target considers two variables: a token's last sale and the maximum sale amount recorded within the token's group. Out-of-the-box loss functions are symmetric, i.e., they do not distinguish between over-or under-valuations. Our approach tinkers with this by looking at FX rate moving averages (over multiple periods) to determine whether over-or under-valuations should be penalized (at a moderate scale to avoid unexpected results).
"Clipped" history & horizons – scrutinizing model performance in extreme scenarios
Those familiar with training schemes are aware of (blocking) time series splits. While we did not re-invent the wheel here, there is value in discussing this here as it adds to our models' resilience to producing valuations. Plus, we have slightly escaped from the conventional implementation of this validation method.
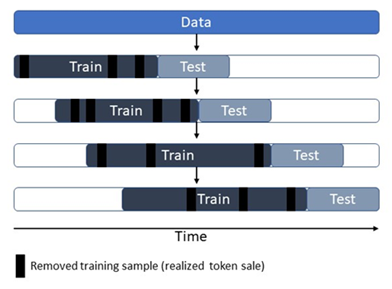
The accepted theory behind time distributed financial data is that they suffer from a phenomenon known as heteroskedasticity, caused by outliers in the data. This simply means that the values our targets assume vary (wildly) over time, with respect to the features used to predict them. To escape from poorly trained models caused by this, we select, train, and test datasets using an increasing time index per split. Moreover, we remove training samples at random per group (to avoid accidentally removing a whole group's samples), to combat model over-fitting.
An educated observation would be that, by removing past and random data points, we reduce the size of the data used to validate the model, which may result in worse performance if they contain useful information. The extent to which these "clips" are made respects the ratio between feature and sample size, often limiting removals to a lower percentage depending on the collection.
We can be wrong… sometimes
There is a certain limit as to how much you can automate, especially considering the uniqueness that characterizes NFT collections across the board. Issues arise when there is no clear sense of grouping. Prime examples are ArtBlock projects, where both ends of the extreme lie. One is the absence of enough metadata to go by, and the other is the extreme size and variety of metadata that can confuse even the brightest NFT collectors out there.
At NFT Valuations, we want to take it a step further. Especially for projects lacking metadata, we can still extract helpful meta-features using the image. Advances in deep learning make this step possible, with open-source methods to extract and group images automatically. This is possible through a learning process that trains models to re-construct any set of given images. And since a picture is worth a thousand words, here are some test results on a set of apes being re-drawn by a deep convolutional autoencoder model. Quite neat.

Another clear issue that we currently face is how to assign a valuation to tokens that have been bought as part of a bundle. The truth is, we could use their NFTi or Adjusted Floor valuations at the time and work out a "percentage of contribution" to the overall sale. But this is not a definitive approach, and it remains on our to-do list.
Summary
To both scale and be as accurate as possible in valuing NFTs, we have utilized metadata, historical market data, and our own derived grouping information. The latter plays a key role in eliminating noise or irrelevant information from sales of other tokens in the collection. We adopt an asymmetric loss function that respects the grouping properties to allow us to scale to multiple collections, respecting the current market trend.
Consequently, our ML approach has managed to surpass our expectations. When considering the highly sought-after Cryptopunks collection, our model manages, on average, to be off by 10.9% in its valuations. This is measured by the Mean Absolute Percentage Error (MAPE) metric, which measures how accurate NFT price predictions are. For traditional models, this can go up to 40%, which shows the clear improvement that our approach has offered.
We are staunch believers in the democratization of NFT valuations (our name hints at this 😊). NFTi is at its baby steps still, but with your feedback and the continuous improvements we will be rolling out, we see our vision being realized. We are bringing the best that the machine learning arsenal can provide us, to create a service that helps traders like you better understand this market's potential.